1880 - Measured Temperature Averages - 2019
PawPlot - P.Duinker
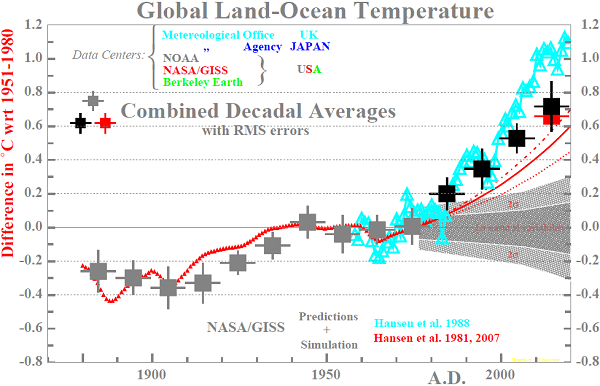 |
| Clicking on a Hansen et al. reference leads to the original publication (the prediction for the 2010's is from their 2007 publication). The text "Combined Decadal Averages", the data points themselves and the references to the Data Centers are clicable and lead to some details of the determination of the averages and the published yearly temperature measurements by the various Centers respectively. The average of the last eight years of the present decennium is also shown. For a pdf-file of the figure click here. |
Key consequences are: (i) emperical evidence that much of the global climate variability on time scales of decades to centuries is deterministic and (ii) improved confidence in the ability of models to predict future CO2 climate effects.
Comments
1. In the late sixties a pioneering climate calculation was published by Syukuro Manabe and Kirk Bryan both of the Geophysical Fluid Dynamics Laboratory at Princeton (USA). For a short historical overview of these type of calculations see a webpage of the NOAA.
2. The prediction of 1981 includes only the anticipated increase of CO2 and not the other greenhouse gasses. The climate sensitivities used for calculating the dashed, the drawn and the dashed-dotted curves were ΔT=1.4 - 2.8 - 5.6 ° C respectively. For the 1988 prediction the contribution of all greenhouse gasses to the temperature rise was estimated rightly, however the climate sensitivity itself was taken at the too high value of ΔT=4.2° C, instead of the presently best estimate of ΔT=3.0±1.0° C.
3. https://pubs.giss.nasa.gov/docs/2007/2007_Hansen_ha00210r.pdf.